History Explorer View
The History Explorer View fetches and displays historical data in a list, event list, and a trend, and can export historical data.
The view consists of two parts. The first part is the "Time Selector", where you can select "Start time", "End time", and other parameters for each item.
Time Selector
You can use the Time Selector to configure the queries for each item. It's possible to drag and drop items into this view to add a new query for items.
You can select "Relative Time" or "Absolute time". If you want absolute time, write the time directly in the text box, or click the calendar symbol on the right side of the text box to select the date and time.
The "Aggregate" field decides which processing will be performed on the data when it is fetched. Depending on the aggregate used, either the "Max Values" field (for raw data) or "Resample" field (for all other aggregates) will be displayed.
The "Resample" field indicates the new time span/interval between two data points after the processing has been performed. This is only applicable when raw data is not selected.
The "Max values" field is only applicable when raw data is selected, and it specifies the maximum number of values which can be fetched from the server.
The "Read History" button must be pushed to fetch data from the database.
You can use the "Add a new query from this item" button to add a new query to the item.
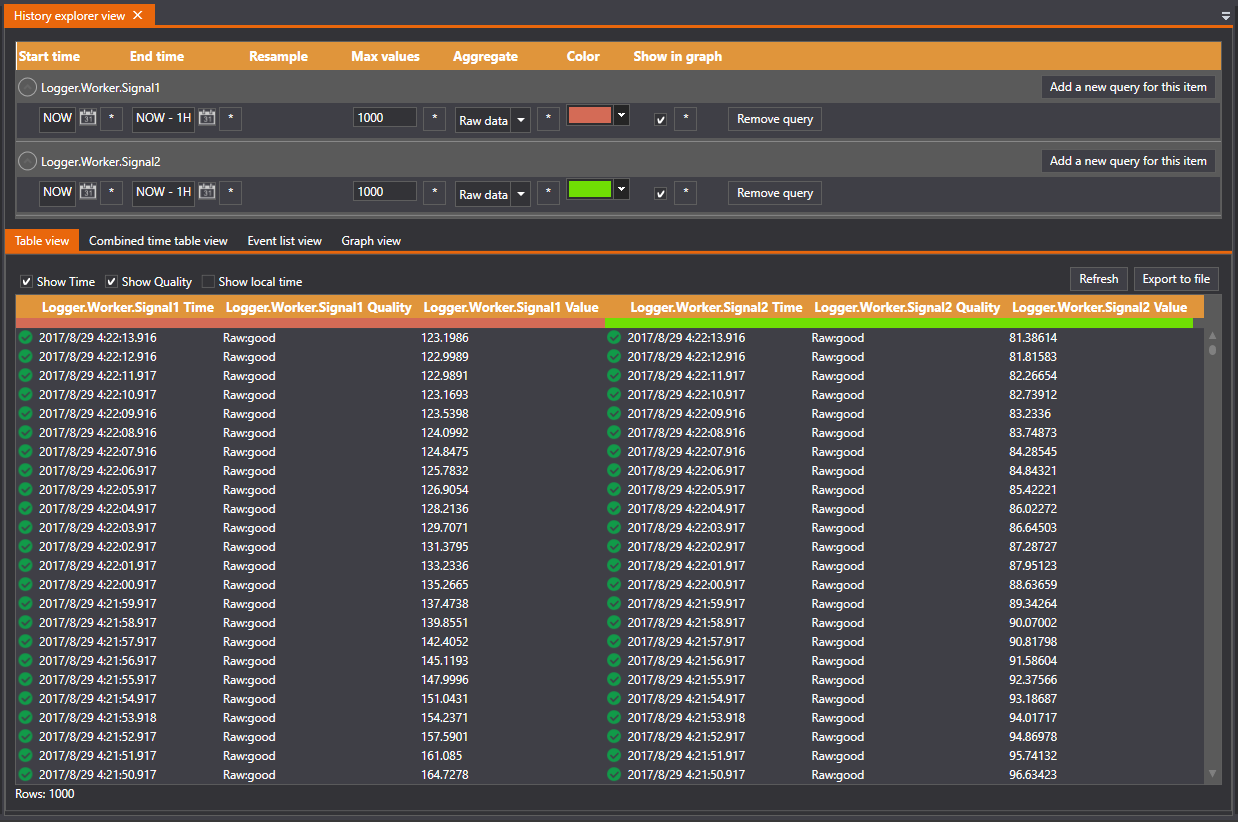
Table view
The table view is where the data is displayed. Several items can be displayed in the same view. For each item, three columns will be displayed. The first column is the time, the second is the quality, and the third is the actual value. You can use the check boxes at the top to hide the time and quality column, and display the local time.
If the raw data for several items is fetched, the number of values for each item might be different. This means that for some items there will be empty rows.
By default, if the start time > the end time, the data is sorting descending, If the end time > the start time, the data is sorting ascending.
Combined time table view
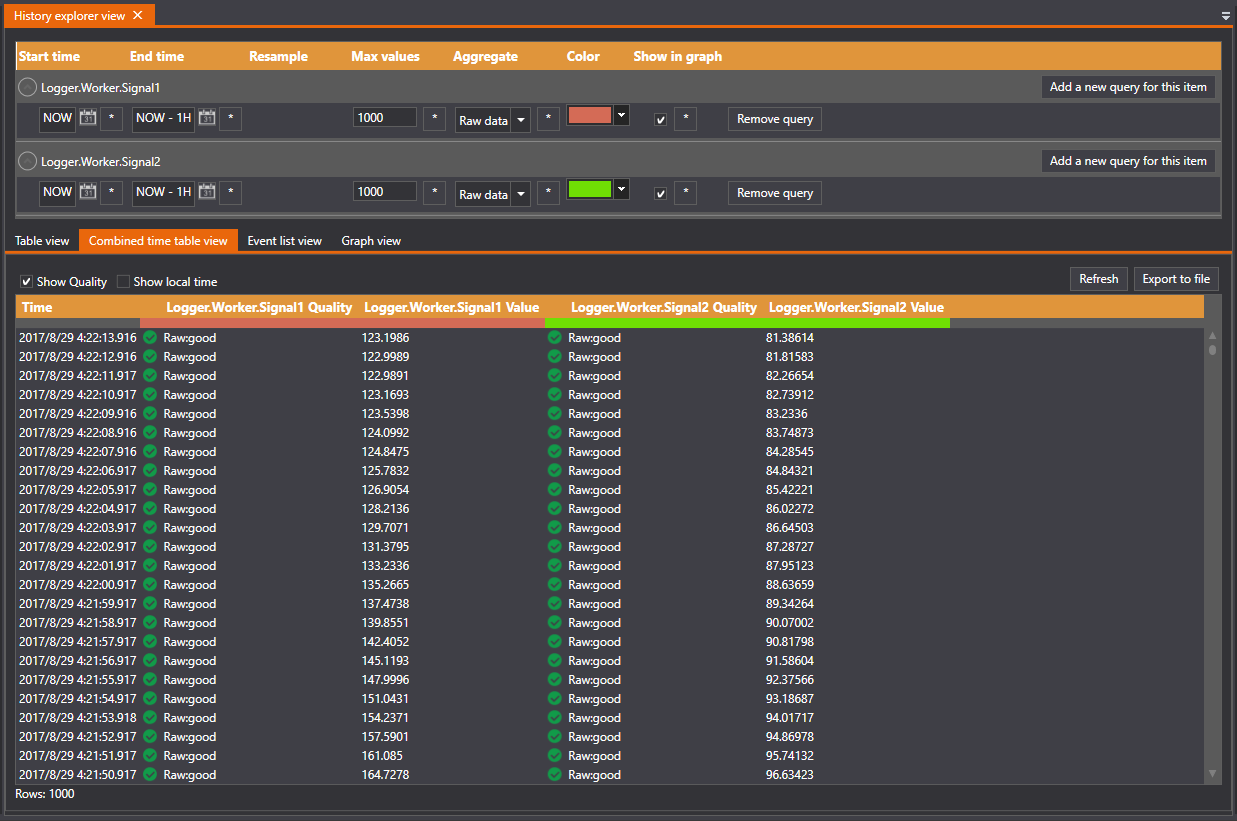
The combined time table view is where the data is displayed as a table with one time column.
The first column is the time, the following columns are the item ID and the quality of each items,
By default, if for all queries the start time > the end time, the data is sorting descending, if for all queries the end time > the start time, the data is sorting ascending, otherwise, the data is ascending.
Event list view
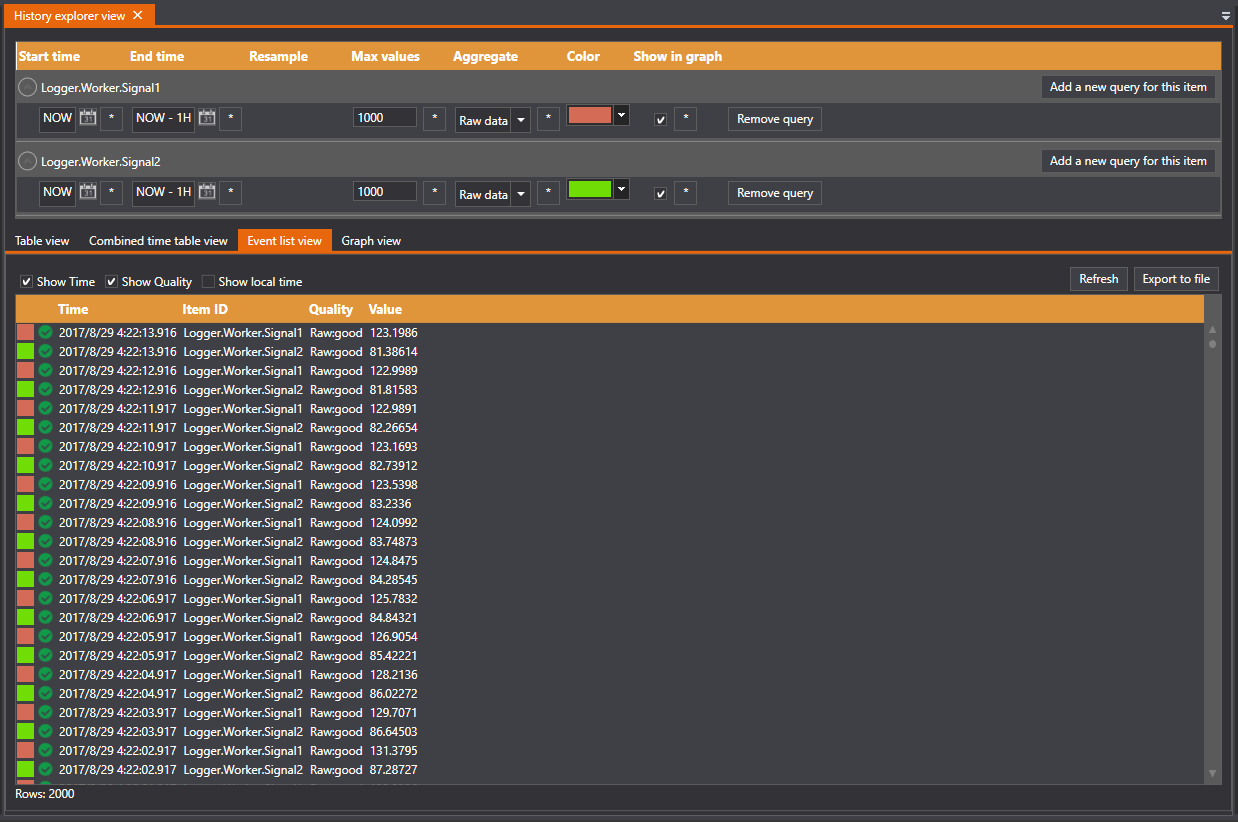
The event list view is where the data is displayed as an event list. This means if more than one item is displayed, the data is organised as a event list ordered by time.
The first column is the time, the second column is the item ID, the third column is the quality, the fourth column is the value.
By default, if for all queries the start time > the end time, the data is sorting descending, if for all queries the end time > the start time, the data is sorting ascending, otherwise, the data is ascending.
Graphical view
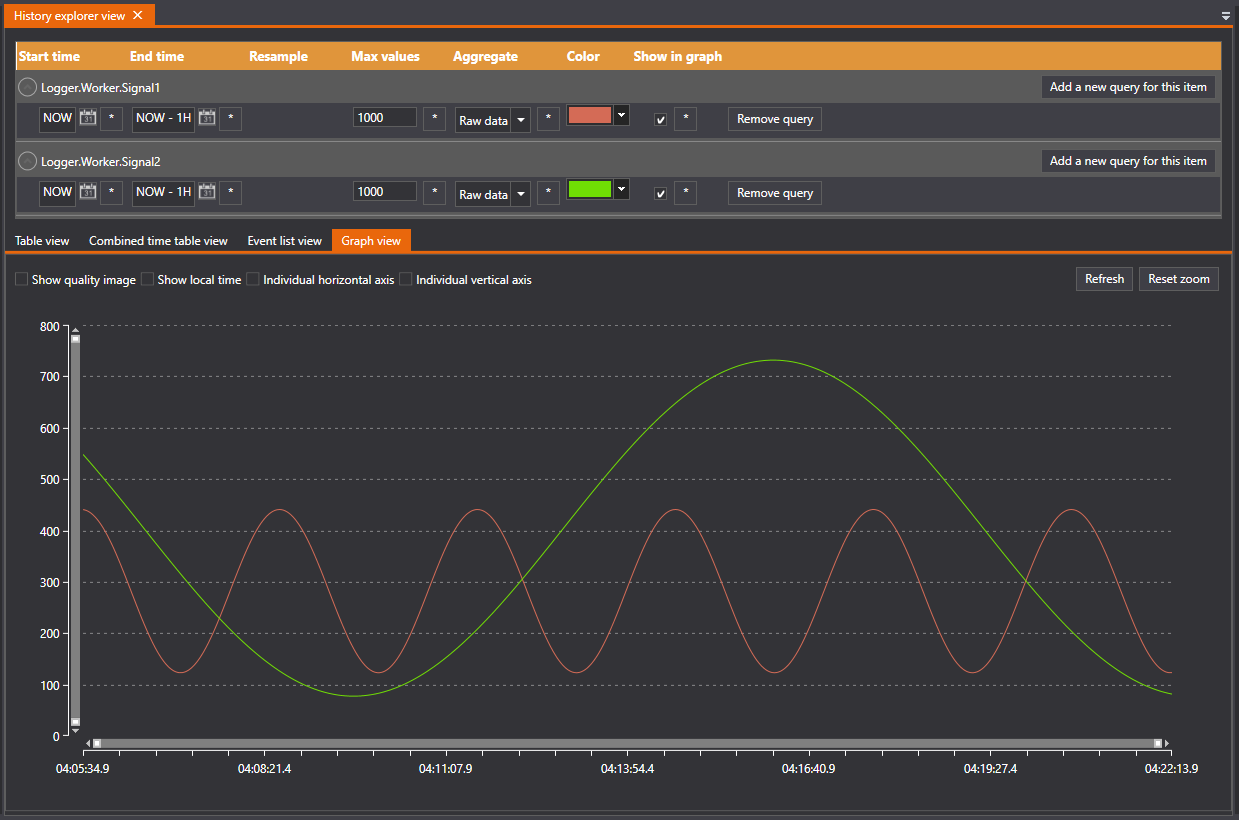
The graphical view is where the data is displayed as a trend.
Export data to file
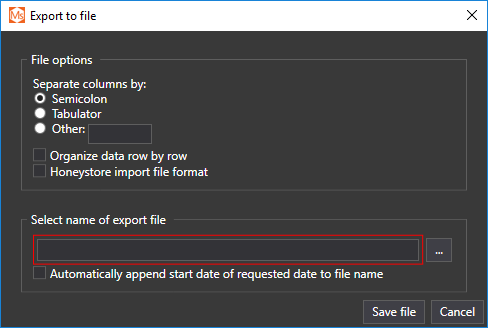
You can click the "Export to file" button to start a dialog to export the data to file.
Adding items to a view
By dragging historical items from the Solution Explorer to the time selector view, the items will be added to the view, and three columns will be added for each item.
Remove items
By clicking the "Delete" button for each query (the button is only displayed when the mouse is hovering) you can delete one query.