How to configure Signal item
This example show you how to add an signal item, which is used to auto generate different types of signal. There are seven different signals types which are supported:
- Sine
- Triangle
- Sawtooth
- Square
- Random
- PeriodicRandom
- Counter
The variable type which support this functionality is the item type Signal on the ApisWorker module.
Add worker module
Follow the guide Add Module to Apis Hive to add a module of type ApisWorker to an Apis Hive Instance.
- After adding the module, select the new module named "Worker" from the Solution Explorer.
- Set the "ExchangeRate" property to e.g. 1000 ms. This is the update rate when this module exchanges data with other modules.
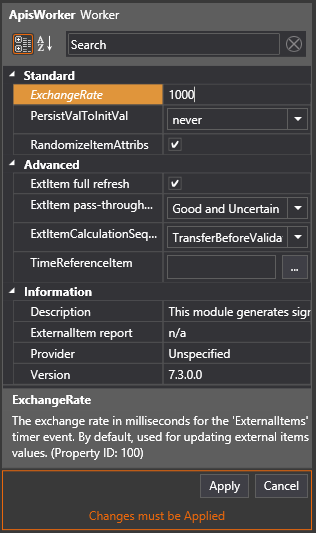
- Click on Apply
Add item type Signal
- Follow the guide Add Items to a Module, but this time select item type "Signal"
- Add 2 items by setting Count to 2
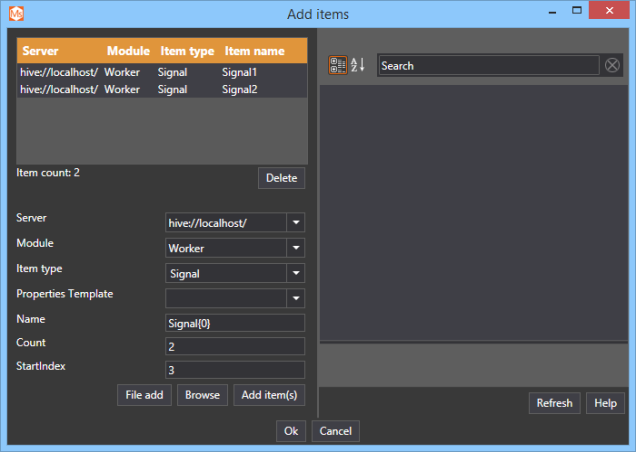
- Click 'Add item(s)'
- Click Ok
Configure item Signal1 as signal type Sine
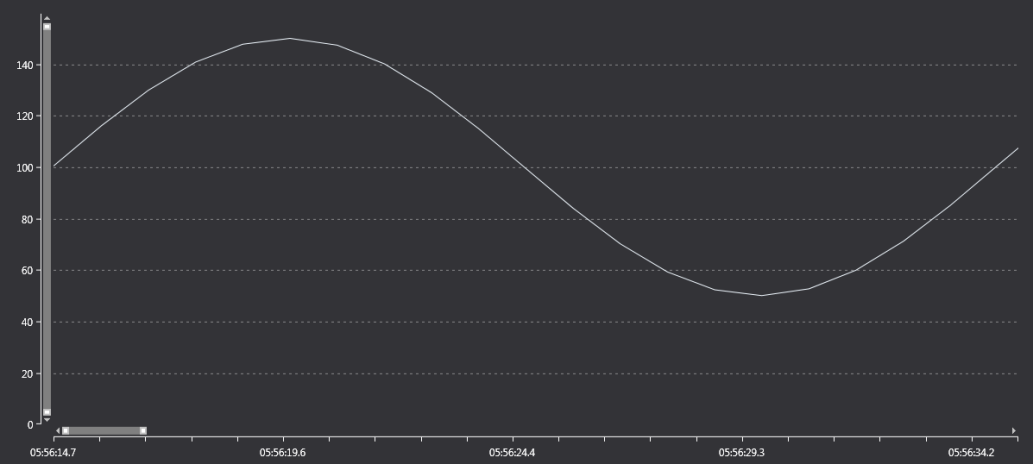
This will show you how to configure a signal that generates a sinus curve with an amplitude of 50. offset (or bias) of 100 and a period of 20 seconds
- Select the item Signal1
- In the attribute window select the attribute Waveform and select the value Sine
- In the attribute window select the attribute Amplitude and set the value to 50
- In the attribute window select the attribute Bias and set the value to 100
- In the attribute window select the attribute Period and set the value to 20
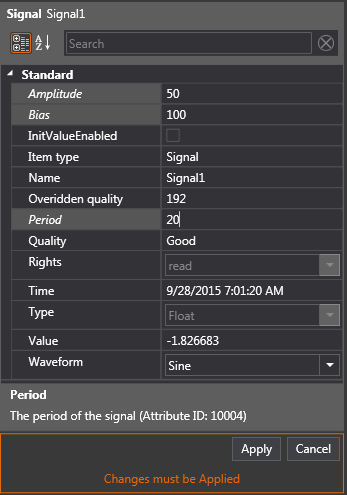
- Click Apply
- You should get an sinus signal with an offset of 100 and amplitude of 50 and a period of 20 seconds as shown below.
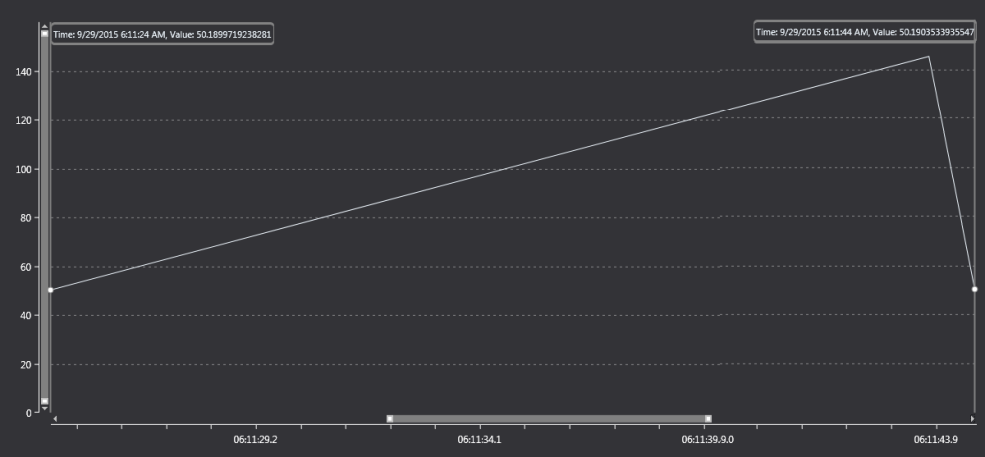
Configure item Signal2 as signal type sawtooth
- Follow the same step as for Signal1 but change the waveform to Sawtooth
- The signal should look like the picture below with the amplitude of 100 and bias of 50. The period is 20 seconds
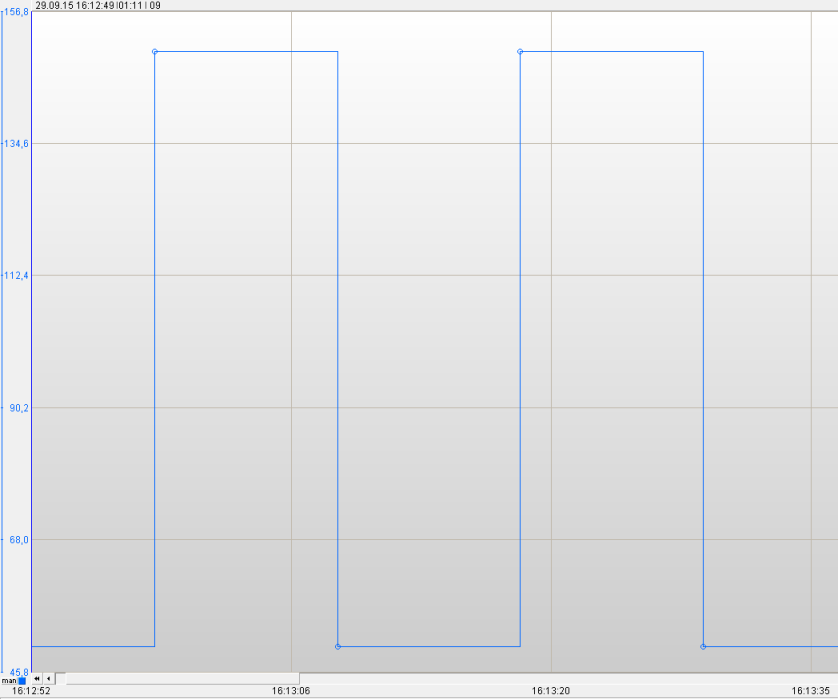
Configure item Signal2 as signal type square
- Follow the same step as for Signal2 but change the waveform to Square.
- The picture below is showing the just the data point with a line drawn between them.
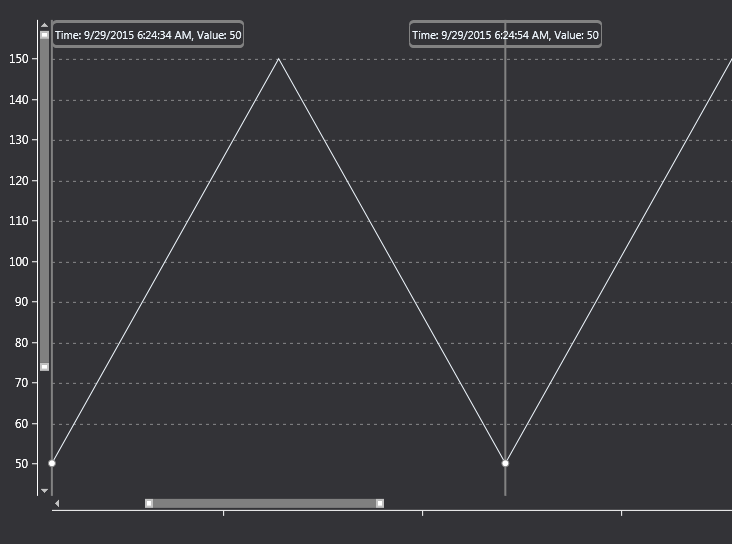
- The picture below shows a graph where the current value is keep until a new value is received. The actual value (raw data)is shown as a circle on the curv.