OPC HDA Aggregates
| Aggregate name | Description | Implemented by APIS |
|---|---|---|
| Interpolative | 1. order interpolated values. | x |
| Total | The totalized value (time integral) of the data over the resample interval. | x |
| Average | The average data over the resample interval. | x |
| Time Average | The time weighted average data over the resample interval. | x |
| Count | The number of raw values over the resample interval. | x |
| Standard Deviation | The standard deviation over the resample interval. | x |
| Minimum Actual Time | The minimum value in the resample interval and the timestamp of the minimum value. | x |
| Minimum | The minimum value in the resample interval. | x |
| Maximum Actual Time | The maximum value in the resample interval and the timestamp of the maximum value. | x |
| Maximum | The maximum value in the resample interval. | x |
| Start | The value at the beginning of the resample interval. The time stamp is the time stamp of the beginning of the interval. | x |
| End | The value at the end of the resample interval. The time stamp is the time stamp of the end of the interval. | x |
| Delta | The difference between the first and last value in the resample interval. | |
| Regression Line Slope | The slope of the regression line over the resample interval. | |
| Regression Line Constant | The intercept of the regression line over the resample interval. This is the value of the regression line at the start of the interval. | |
| Regression Line Error | The standard deviation of the regression line over the resample interval. | |
| Variance | The variance over the sample interval. | x |
| Range | The difference between the minimum and maximum value over the sample interval. | x |
| Duration Good | The duration (in seconds) of time in the interval during which the data is good. | x |
| Duration Bad | The duration (in seconds) of time in the interval during which the data is bad. | x |
| Percent Good | The percent of data (1 equals 100 percent) in the interval, which has good quality. | x |
| Percent Bad | The percent of data (1 equals 100 percent) in the interval, which has bad quality. | x |
| Worst Quality | The worst quality of data in the interval. | x |
| Annotations | The number of annotations in the interval. |
In addition, APIS Honeystore also implements the following vendor specific aggregates.
| Aggregate name | Description |
|---|---|
| Sum | The sum of all raw values over the resample interval. |
| Interpolative zero-order | 0. order interpolated values, aka sample-and-hold. |
| Median | The median is described as the numeric value separating the higher half of a set if values, from the lower half. If a < b < c, then the median of the list {a, b, c} is b, and if a < b < c < d, then the median of the list {a, b, c, d} is the mean of b and c, i.e. it is (b + c)/2. |
| MinimumActualTime2 | UA - The minimum value in the resample interval and its timestamp, including bounding values. |
| MaximumActualTime2 | UA - The maximum value in the resample interval and its timestamp, including bounding values. |
| Range2 | UA - The Range2 Aggregate finds the difference between the maximum and minimum values in the i nterval as returned by the Minimum2 and Maximum2 Aggregates. Note that the range is always zero or positive. |
| PercentGood (UA) | UA - Retrieve the percent of data (0 to 100) in the interval which has a good StatusCode. |
| PercentBad (UA) | UA - Retrieve the percent of data (0 to 100) in the interval which has a bad StatusCode. |
| VectorElementSum | Caclulates the sum of vector elements individually (Not OPC HDA compliant) |
| VectorElementAverage | Caclulates the average of vector elements individually (Not OPC HDA compliant) |
| VectorElementMin | Finds the minimum of vector elements individually (Not OPC HDA compliant) |
| VectorElementMax | Finds the maximum of vector elements individually (Not OPC HDA compliant) |
| DisplayValues | Values that give the best trend curve representation for a specific number of pixels. The desired start/end time and the number of x-pixels (nx) available, are used to divide the period into nx resample intervals (1 resample interval per x-pixel). For each resample interval, anything from 0 to 4 data points may be returned. At most, the following data points are returned for each resample interval: the first data point, the maximum data point, the minimum data point and the last data point.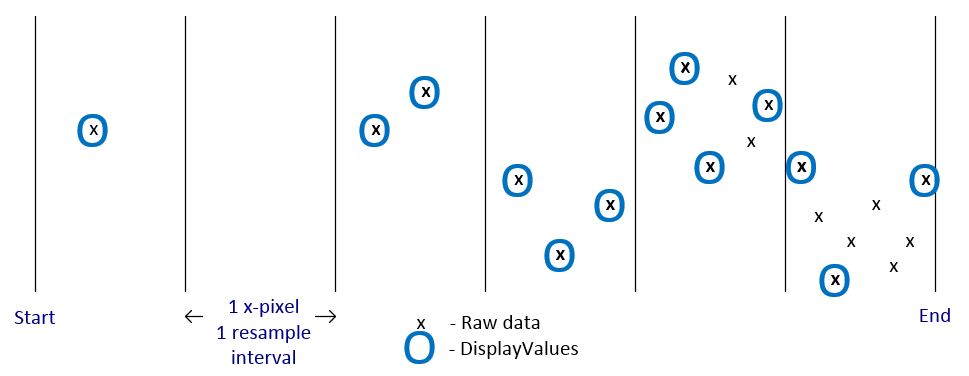 |
| LowpassFilter | Lowpass filtering of the RAW data for the given period. The number of datapoints returned is the same as the number of raw datapoints. The resample interval is interpreted as the time-constant (T). The algorithm is: v(n+1) = v(n) + dT*(v(n+1) - v(n))/T where v - value n - datapoint index dT = timestamp(n+1) - timestamp(n) If T <= dT, no filtering is applied to avoid instability. |
| MovingAverageByCount | Moving average of the RAW data for the given period, ignoring the time between datapoints. The number of datapoints returned is the same as the number of raw datapoints. The resample interval is interpreted as the number of values in the window. For the first window, a cumulative average is applied. |
| MovingAverageByTime | Moving average of the RAW data for the given period, taking the time between datapoints into account. The number of datapoints returned is the same as the number of raw datapoints. The resample interval is interpreted as the the window size. For the first window, a cumulative average is applied. |